

In stock trading, identifying trend reversals early gives an edge to the trader as it enables them to get into trade early and ride the trend longer. Chart patterns are one such way to identify trend reversals early. These chart patterns give early insights into shifts in the market psychology and represent them visually.
 An Inverse Head and Shoulders pattern in a chart looks like two shoulders and a head that is flipped vertically. As told earlier, the pattern has three downswings or troughs with two peaks in between. This is shown in the image alongside.
 Trading this chart pattern is straightforward as there is clearly defined entry, exit stop-loss and target rules.

The other day we talked about the Head and Shoulders chart pattern. Today we will learn about other reversal pattern which is closely related to Head and shoulders pattern- Inverse Head and Shoulders pattern.
What is Inverse Head and Shoulders chart pattern?-
An inverse head and shoulders pattern is a bullish reversal chart pattern that forms after a downtrend. Three distinct downswings with two peaks in between them forms the pattern. The two downswings on either side form the two shoulders and the third downswing in the middle forms head of this chart formation. A line joining the peaks of the two shoulders forms the neckline.
A break above this neckline completes the chart pattern.
Now that you have a preliminary idea about this chart pattern, let's delve deeper into identification of Inverse Head and shoulders pattern.
How to identify Inverse Head and Shoulders chart pattern in chart?

An inverse head and shoulder pattern forms towards the end of a downtrend.
The first trough is in continuation with the downtrend. This trough usually has decent volume. After this trough, there is a modest rise in price, often with diminished volume forming the first peak of the pattern. This trough and subsequent correction forms the left shoulder of the pattern. See the schematic diagram shown alongside.
Another deep trough forms after formation of left shoulder, and this time price falls even further, making a lower low. But volume remains low to moderate during this downfall in price. A deep correction follows this, which is usually deep and extends beyond the low of left shoulder. This latest fall in price followed by a decent correction forms the head of the pattern.
Another fall in price ensues after the head formation, but this time the price fails to reach previous low (the low of head). This last trough is often associated with scarce volume. A correction of price from this higher low forms the right shoulder.
A neckline is then drawn by connecting the tops of two peaks (the highest points on either side of head)
A breakout above this neckline completes the Inverse head and shoulders chart pattern.
Let me help you identify this pattern in a chart.
 |
| Chart showing Inverse Head and Shoulders Pattern |
Trader's psychology behind Inverse Head and Shoulders chart pattern-
The left shoulder is in continuation of the prevailing downtrend where sellers are dominating. A high volume while formation of left shoulder suggests there is profound bearish sentiment.
The head depicts strong bearish push by the sellers as the price makes a lower low. A deep correction after this downfall with moderate volume suggests the sellers are getting exhausted and buyers are just starting to take the charge.
The last weak and exhausted push by the bears makes the right shoulder, which is promptly and strongly reversed by the bulls. According to an article on Investopedia on inverse head and shoulders pattern, this right shoulder doesn't only symbolize a waning seller pressure but also a possible accumulation.
Further after formation of right shoulder, breakout above the neckline, usually with high volume, completes the pattern marking the end of the downtrend. This breakout suggests the buyers are in total control now.
Entry and Exit strategy for Inverse Head and Shoulders Pattern-
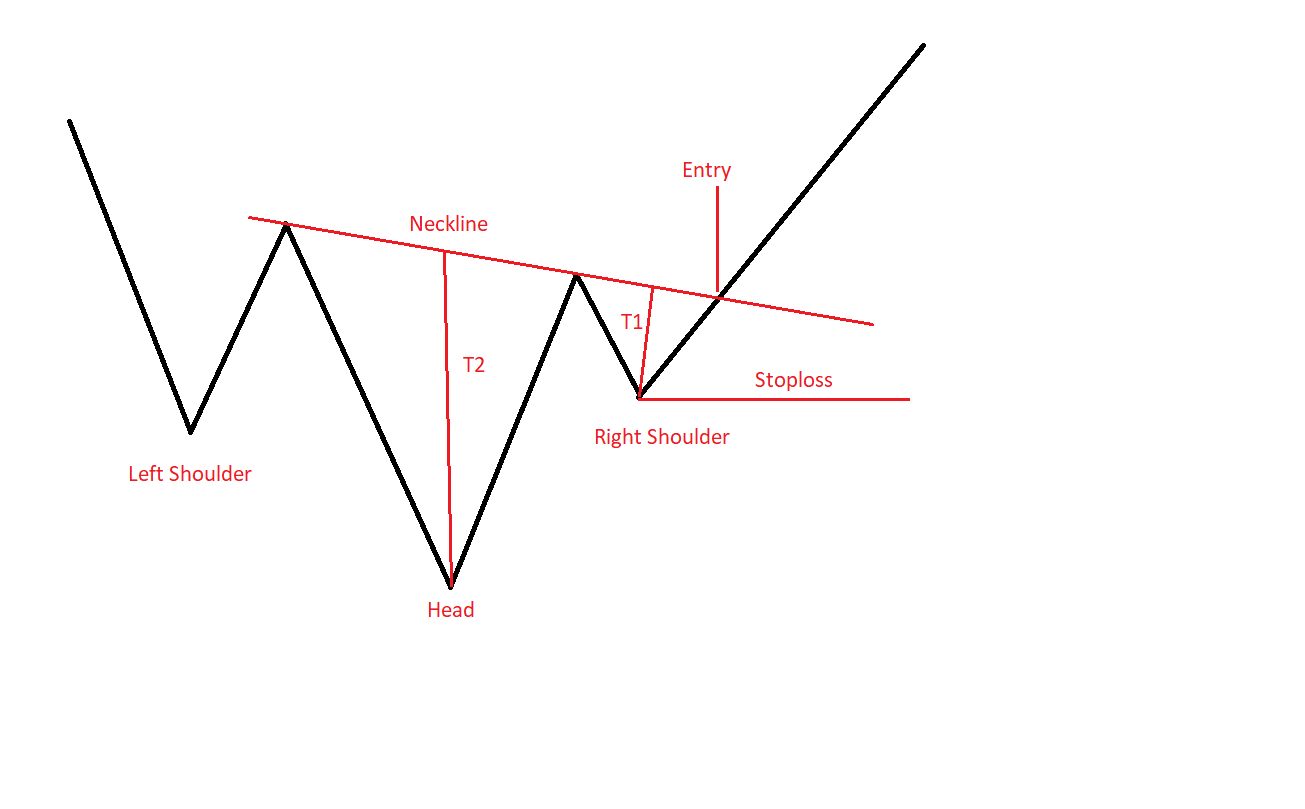
Entry rule- Enter a long trade when the price breaks above the neckline with strong volume. Some traders wait for a retest of neckline before entering to avoid false breakouts. Many other traders buy when price breakouts and add some more positions when the neckline gets retested.
Stop-loss Placement- Place Stop-loss just below the low of the right shoulder. Although many accept placing a stop loss below the right shoulder, some sources differ and recommend a stop-loss placement below neckline, like this article on TrendSpider on this chart pattern. However, this tight stop-loss placement comes with a disadvantage of prematurely getting out of the trade especially when the market is volatile.
Target- Distance from the neckline to the low of right shoulder projected upwards from the breakout point is the first target. Once this first target is achieved you trail your stop-loss to breakeven point. You may liquidate some of your position at this point and hold some for the second target.
The second target is distance from the neckline to the lowest point of the head projected upwards from the breakout point.
Let's see this in a chart.
 |
| Chart showing Entry, Stop-Loss and Target rules in an Inverse Head and Shoulders Pattern |
Best indicators to confirm Inverse Head and Shoulders Pattern-
Though Inverse Head and Shoulders Pattern is a reliable pattern, adding indicators provide an extra layer of confirmation and improves probability of a gainful trade.
Here are some indicators that you can combine with this pattern to make better trading decisions.
Volume- A volume confirmation buoys the chances of a successful trade with this pattern. Volume should lessen during the formation of right shoulder, signifying the seller's weakness and it should increase while breakout reinforcing the buyer's strength.
In the chart above, you can see a diminishing volume while right shoulder is forming. Also, notice that the breakout candle has enormous volume support as shown by a tall bar below the candle.
Relative Strength Index (RSI)- RSI is a momentum indicator. RSI value above 50 while price breakouts from the neckline suggest a valid breakout. A bullish RSI divergence at the left shoulder and head is a powerful signal of reversal and further augments the probability of a profitable trade.
Let's see this in a chart.

Other indicators which confirm inverse head and shoulders pattern are MACD and Moving average. A bullish MACD crossover during or just prior to breakout confirms the momentum and breakout signal. Further, a golden crossover between EMA 50 and EMA 200 during or prior to breakout suggests the broader trend is shifting upwards and confirms the inverse head and shoulders pattern.
Final thoughts and key takeaways-
The inverse head and shoulders pattern is one of the most reliable reversal patterns in technical analysis. When identified correctly and confirmed with volume and other indicators, it can provide profitable entry points at the beginning of an uptrend. Let's take a look at important points-
- Look for the pattern following downtrend
- Confirm the structure- the left shoulder, head and right shoulder.
- Enter when price breakouts from the neckline with enormous volume.
- Confirm your entry with other indicators like volume, RSI, MACD and moving averages
- Set stop-loss just below the right shoulder.
Also learn another bullish reversal chart pattern- The Double Bottom Chart Pattern.
Post a Comment