What Are Chart Patterns in Technical Analysis?
In technical analysis, chart patterns are visual formations on price charts that traders use to predict future price movement. The collective psychology of buyers and sellers forms these patterns, often signaling either a continuation or a reversal of the prevailing trend.
Some patterns resemble shapes like triangles, flags, or even human anatomy—like the Head and Shoulders, which is one of the most reliable reversal patterns in trading.
What Is the Head and Shoulders Chart Pattern?
The Head and Shoulders chart pattern is a bearish reversal chart formation that typically appears after an uptrend. It signals that the bullish momentum is weakening and a potential downtrend could begin.
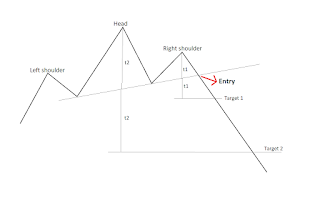
It’s called “Head and Shoulders” because the shape it looks like. On chart, this pattern looks like head and two shoulders of a human and a trend line below the shoulders forms the neckline. You would learn this in paragraphs below.
How to identify Head and Shoulders chart Pattern in trading?
Left Shoulder–Left shoulder is formed by an upswing that pushes price up which is in accordance with the ongoing uptrend. The left shoulder is often accompanied with heavy volume to support the up move. After the upswing there is a slight correction in price usually on lesser volume.
Head – After the correction in price following left shoulder, the buyers once again take the charge, pushing the price further up making a new high. According to wikipedia, this move is often accompanied by normal to heavy volume and occurs near a resistance zone. This fresh upswing forms the head of the pattern. Following this fresh upswing there is another correction
Right Shoulder–The third upswing occurs after the head formation. Volume does not support this upswing and price fails to reach the previous high and starts falling, forming the right shoulder of the pattern.
Neckline–The neckline is formed by joining a trend line across the low points (troughs) adjoining the head.
A Head and Shoulders chart pattern is completed once the price falls below the neckline, suggesting the market has reversed from an uptrend to a downtrend.
The Psychology Behind the Head and Shoulders Pattern
Understanding the emotional cycle behind the pattern helps you trade it with confidence.
Left Shoulder: Left shoulder is driven by optimism among the buyers who push the prices up with good volumes. Till now the bullish sentiments from the existing uptrend is carried forward.
Head: Head part of the pattern is another try by the buyers to push prices further up, often accompanied with normal or heavy volume volume. This is the point where smart money starts liquidating their position in small bits and pieces.
Right Shoulder: This is area where bulls further loose control and bears take the control.
Neckline Break: Fear and exit — buyers rush to close positions, and sellers dominate once the price break below the neckline.
How to Trade the Head and Shoulders Pattern-
Entry:
Enter short (or exit long) when price breaks below the neckline, ideally with increased volume.
The breakdown candle should close below the neckline for confirmation.
Stop-Loss:
Place the stop-loss just above the right shoulder to protect against false breakouts.
Target:
The distance from the neckline to the top of right shoulder forms the first target and distance from neckline to the top of head forms the second target,
Indicators to use with Head and Shoulders Chart Pattern
To avoid false signals and increase confidence, you should combine the Head and Shoulders pattern with indicators.
Volume Confirmation
Volume should ideally increase on the neckline break, showing strong selling pressure.
Volume should be lighter during the formation of the right shoulder, signaling waning buyer interest.
RSI (Relative Strength Index)
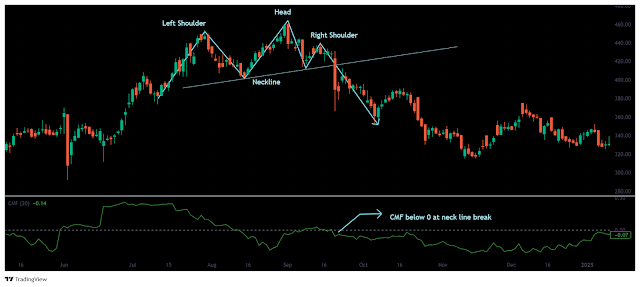
If RSI forms a bearish divergence (i.e., price forms higher highs while RSI forms lower highs), it confirms the loss of momentum. This validates the head and shoulders pattern. See the chart below.
A bearish MACD crossover (when MACD line crosses below signal line) around the right shoulder or neckline breakdown adds further confirmation.
Chaikin Money Flow (CMF)
If CMF drops below 0 as the neckline breaks, it shows that institutional selling is picking up—another strong bearish clue.
How reliable is Head and shoulders pattern?
Summary: Head and Shoulders Pattern Trading Blueprint
| Component | Description |
|---|---|
| Pattern Type | Bearish Reversal |
| Market Condition | After an uptrend |
| Entry Signal | Price breaks below neckline |
| Stop-Loss | Above right shoulder |
| Target | Height from head to neckline |
| Confirmation Tools | Volume, RSI divergence, MACD, CMF |
Final Thoughts
The Head and Shoulders chart pattern is one of the most reliable patterns for spotting market tops and bearish reversals. Its power lies in its predictive structure, backed by market psychology and technical confirmation.
While it can be tempting to trade the pattern as soon as it appears, combining it with volume analysis, RSI, MACD, or CMF gives you a far better chance of success. Always use a stop-loss and practice proper risk management.


Post a Comment